With increasing institutional interest, cryptocurrencies are becoming a core component of global investment strategies. This article explores market news, secure trading techniques, advanced analysis, and future trends to support informed decisions.
Expert insights included
- Institutional trends: Market influence and impact.
- Secure trading techniques: Protect investments.
- Advanced analysis: Understand complex market behavior.
- Future outlook: Anticipate upcoming opportunities.
Cryptocurrency markets move fast and trade 24/7, making price charts one of the most essential tools for traders and investors. Whether you are looking at Bitcoin, Ethereum, or any alternative coin, learning to read charts helps you understand platform sentiment, spot trends, and make more informed decisions.
This guide explains the basics step by step — from chart types and candlestick anatomy to trends, patterns, and key indicators — so you can start analyzing crypto charts with confidence.


Understanding the Basics of Crypto Charts
Every crypto chart has two main axes:
- The horizontal X-axis represents time (from minutes to years, depending on the timeframe you choose).
- The vertical Y-axis shows the price of the crypto.
You can switch between different timeframes on most platforms (such as TradingView, Binance, or Coinbase). Beginners often start with 1-hour or 4-hour charts, while day traders use 5-minute or 15-minute intervals, and long-term investors prefer daily or weekly views.
There are three common types of charts:
- Line charts: The simplest form. They connect only the closing prices over time, giving a clean overview of the overall movement. Ideal for quick glances but lacking detailed information.
- Bar charts: Show the open, high, low, and close (OHLC) for each period as vertical bars with small ticks.
- Candlestick charts: The most popular and informative type in crypto marketplace. Each “candle” visually represents price action during a specific time period.
Most traders rely on candlestick charts because they provide rich information at a glance.
Anatomy of a Candlestick
Each candlestick tells the story of the battle between buyers (bulls) and sellers (bears) during that timeframe.
A single candlestick consists of:
- The body: The thick rectangular part. It shows the opening and closing prices.
- If the closing price is higher than the opening price, the body is usually green (or white) — indicating positive momentum.
- If the closing price is lower than the opening price, the body is usually red (or black) — indicating negative pressure.
- The wicks (or shadows): Thin lines extending above and below the body.
- The upper wick shows the highest price reached during the period.
- The lower wick shows the lowest price reached.
A long body means strong conviction from buyers or sellers. Long wicks suggest rejection or indecision — for example, a long upper wick may indicate that sellers pushed the price down after an initial rise.
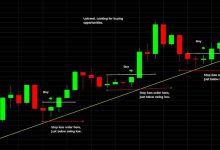
Identifying Trends on Crypto Charts
Trends are the foundation of technical analysis. Prices rarely move in straight lines; they generally follow three types of trends:
- Uptrend (Bullish): Higher highs and higher lows. The overall direction is upward.
- Downtrend (Bearish): Lower highs and lower lows. The platform is declining.
- Sideways (Range-bound): Price moves within a horizontal channel with no clear direction.
To spot a movement, draw movement lines connecting the lows in an uptrend or the highs in a downtrend. A break of the movement line often signals a potential reversal.
Support and barrier levels are also crucial:
- Support: A price level where buying interest is strong enough to prevent further decline.
- Resistance: A price level where selling pressure tends to stop upward movement.
These levels often act as psychological barriers and can flip roles once broken (base becoming barrier, and vice versa).
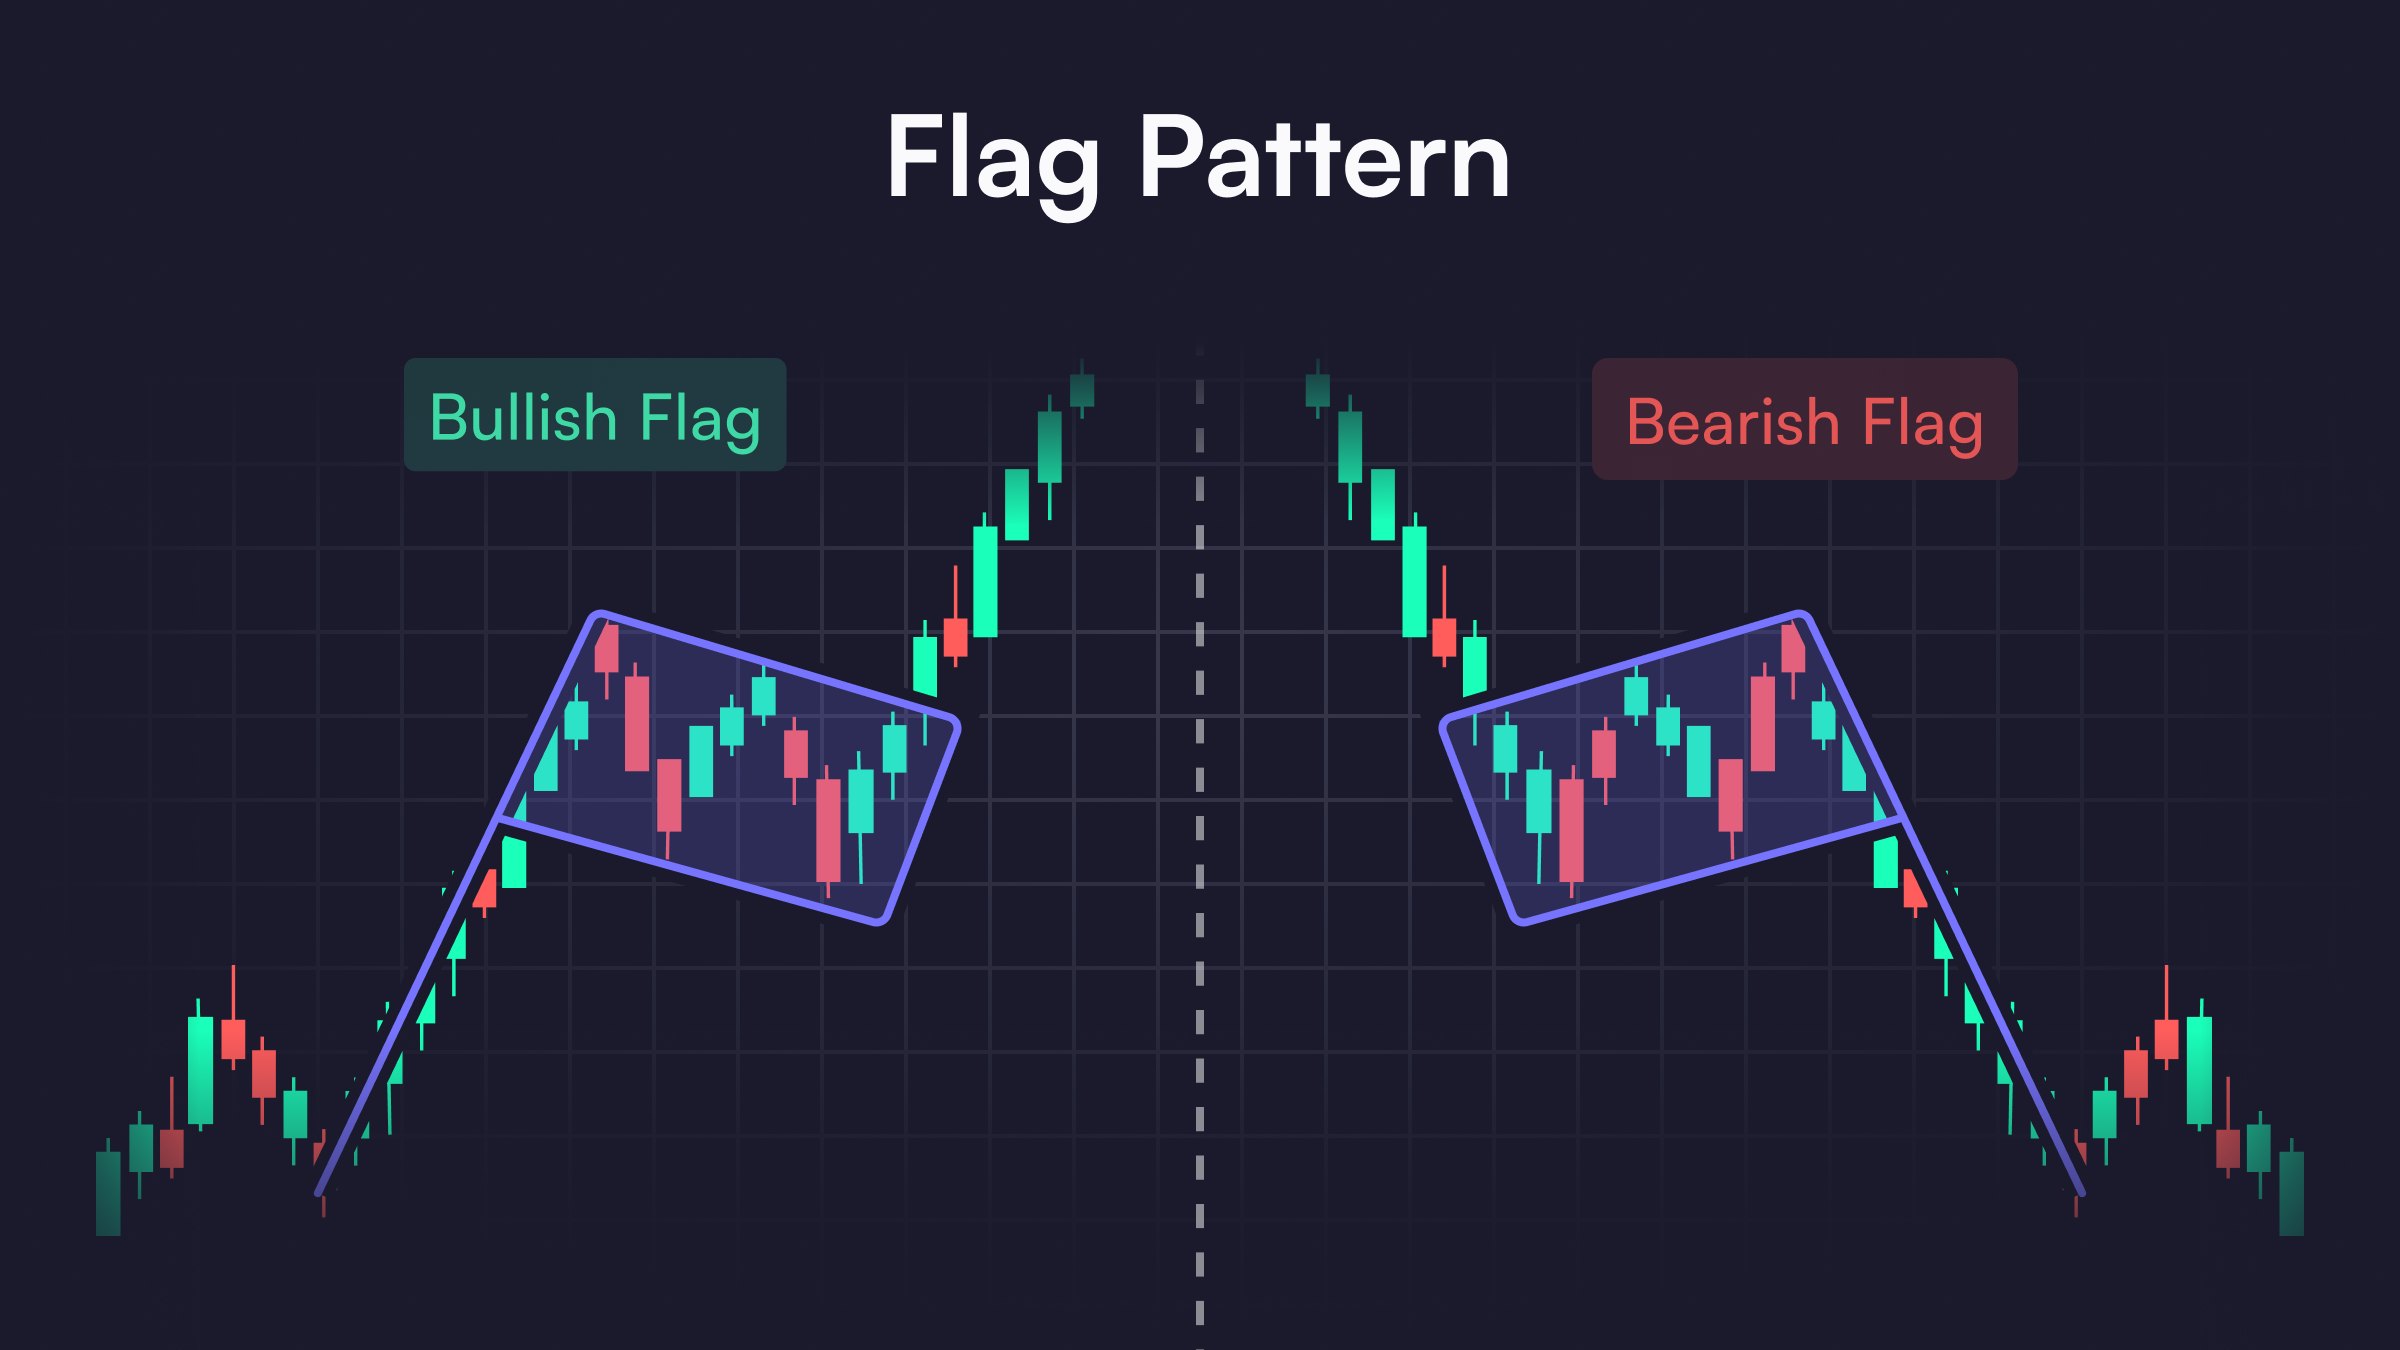
Common Candlestick Patterns
Candlestick patterns help predict potential reversals or continuations. Here are some of the most useful ones in crypto:
Bullish patterns (suggesting upward movement):
- Hammer: A small body with a long lower wick. It often appears at the bottom of a downtrend, showing that buyers stepped in after prices dipped.
- Bullish Engulfing: A large green candle that completely engulfs the previous red candle. It signals a strong shift from sellers to buyers.
- Morning Star: A three-candle pattern (negative candle, small/doji candle, then strong positive candle) indicating a potential reversal upward.
Bearish patterns (suggesting downward movement):
- Shooting Star: Small body with a long upper wick at the top of an uptrend.
- Bearish Engulfing: A large red candle that engulfs the previous green one.
- Evening Star: The opposite of the Morning Star, signaling a potential top.
Indecision patterns:
- Doji: When the open and close are almost the same, creating a very small body. It often appears before major reversals as the platform hesitates.
Always confirm patterns with activity and other indicators rather than relying on them in isolation.
Key Technical Indicators to Use with Charts
Candlesticks alone are powerful, but combining them with indicators provides stronger signals:
- Moving Averages (MA): Smooth out price data to identify trends. A “Golden Cross” (short-term MA crossing above long-term MA) is often positive.
- Relative Strength Index (RSI): Measures momentum on a scale of 0–100. Above 70 suggests overbought conditions (possible pullback), while below 30 indicates oversold (possible bounce).
- MACD (Moving Average Convergence Divergence): Shows changes in strength, direction, and duration of a movement.
- Volume: Bars at the bottom of the chart. Rising activity during a price move confirms the movement’s strength. Low activity may signal weakness.
Many platforms also offer Bollinger Bands, Fibonacci retracements, and Ichimoku Cloud for more advanced analysis.
Practical Tips for Reading Crypto Charts Effectively
- Start simple — Master candlesticks and trends before adding too many indicators.
- Use multiple timeframes — Check the daily chart for the bigger picture, then zoom into lower timeframes for entry points.
- Always consider activity — A surge on high activity is more reliable than one on low activity.
- Watch for news and on-system data — Charts reflect sentiment, but external events (regulations, halvings, or major announcements) can override technical signals.
- Practice on historical charts — Replay past Bitcoin or Ethereum movements to train your eye without risking money.
- Manage risk — Even the clearest patterns can fail. Use stop-decline orders and never invest more than you can afford to lose.